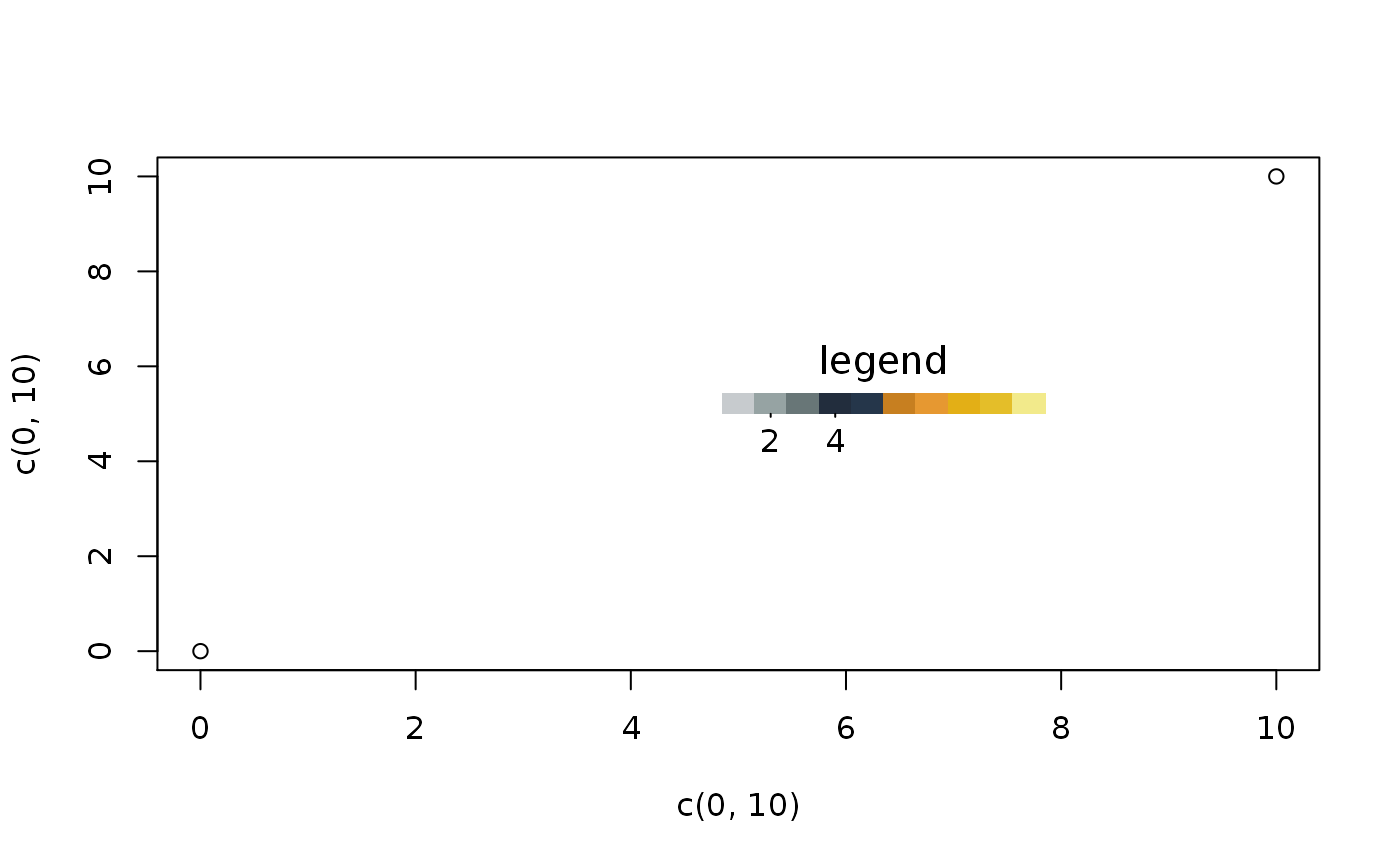
Simple and flexible color scale.
colorScale(
  x,
  y,
  col,
  at = NULL,
  labels = NULL,
  horiz = TRUE,
  percx = NULL,
  percy = NULL,
  adj = 0,
  labels.cex = 1,
  title = "legend",
  title.cex = 1.2
)
Arguments
| x | x-coordinates of the bottom-left corner of the legend. |
|---|---|
| y | y-coordinates of the bottom-left corner of the legend. |
| col | vector of colors. |
| at | vector of integers indicating colors to be labeled. |
| labels | labels. |
| horiz | a logical. Should the color scale be horizontal? |
| percx | size of the color scale along x axis. |
| percy | size of the color scale along y axis. |
| adj | adjust the position labels position. If |
| labels.cex | magnification to be used for labels. |
| title | legend title. |
| title.cex | magnification to be used for the title. |