Draw a box around a plot.
box2(side, which = c("plot", "figure", "outer", "inner"), fill = NULL, ...)
Arguments
| side | a numerical or character vector or a character string specifying which side(s) of the plot the box is to be drawn (see details). |
|---|---|
| which | a character, one of |
| fill | the color to be used to fill the box. |
| ... | further graphical parameters (see |
Details
This function intends to give more flexibility to the graphics::box() function.
As which parameter, the user provides an object first coerced by as.character to a character string that is secondly split into single characters. For all of these characters, matches are sought with all elements of 1, 2, 3, 4, b, l, t, r where 1=below, 2=left, 3=above, 4=right, b=below, l=left, t=above and r=right.
See also
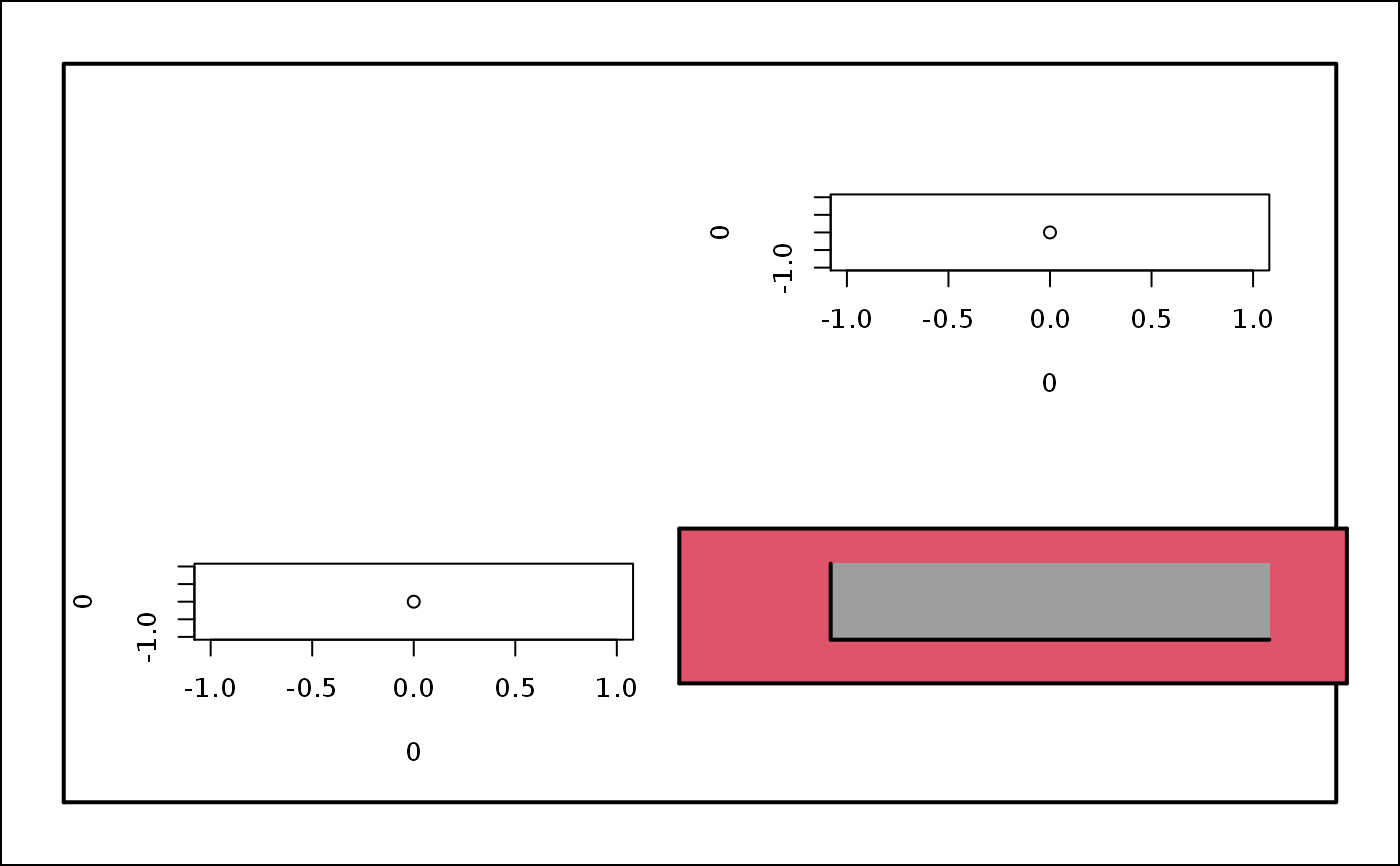
Examples
box2()box2('14', fill='grey80', lwd=2)# Example 3: par(mfrow=c(2,2),oma=c(2,2,2,2)) plot0(0,0) box('outer',lwd=2) box('inner',lwd=2) plot.default(0,0) plot.default(0,0) plot0()box2(which='figure',lwd=2, fill=2)box2(side=12, lwd=2, fill=8)