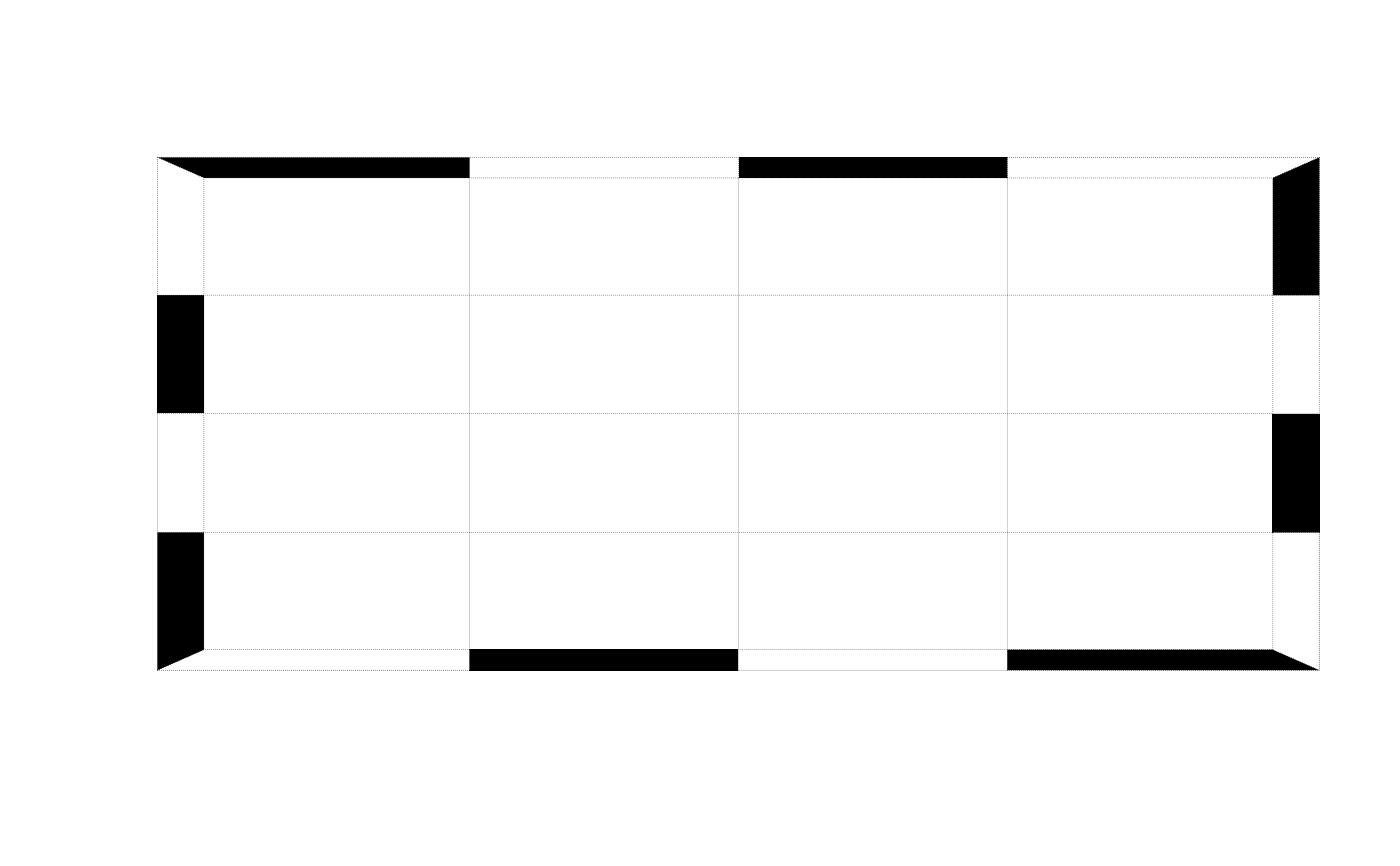
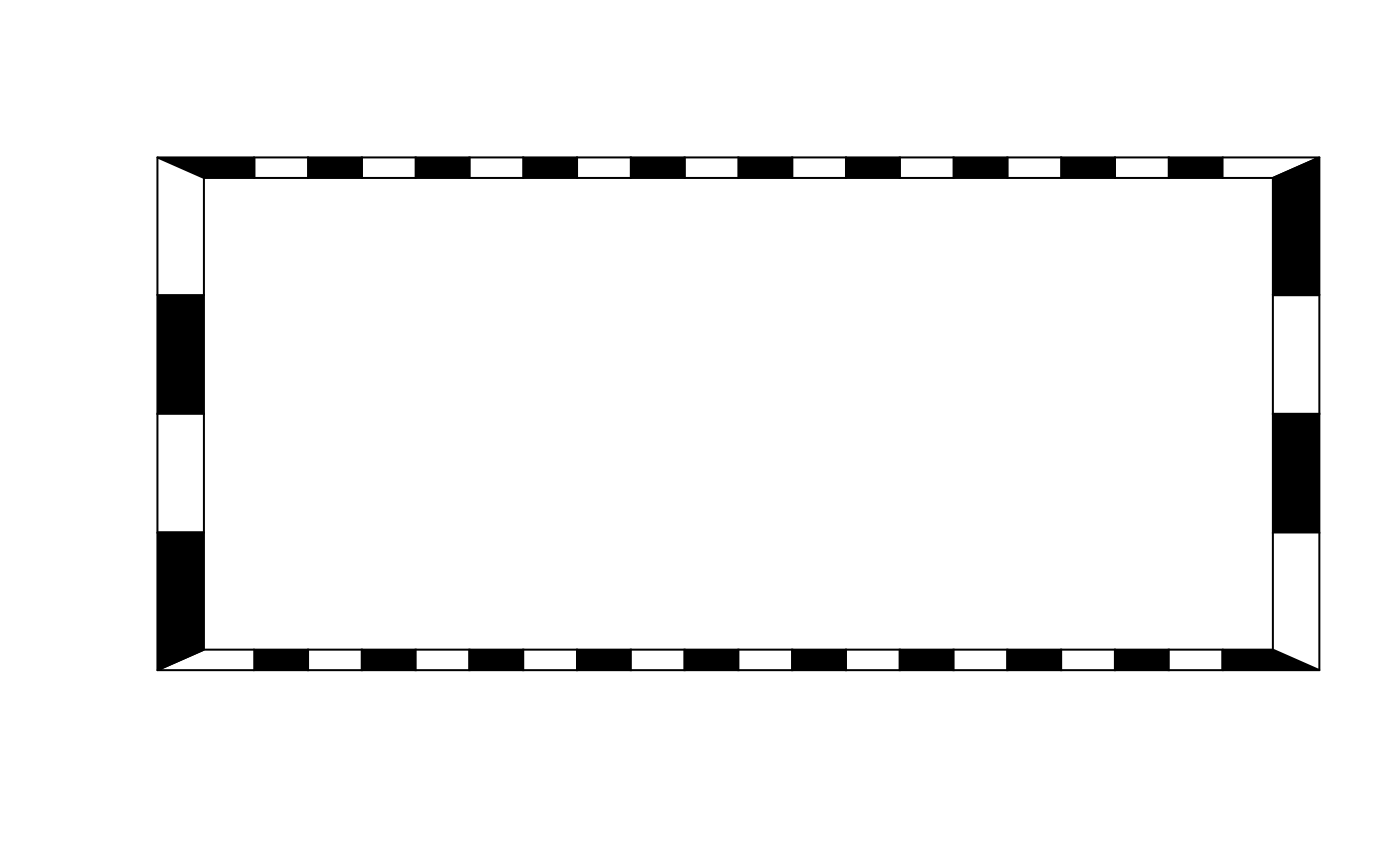
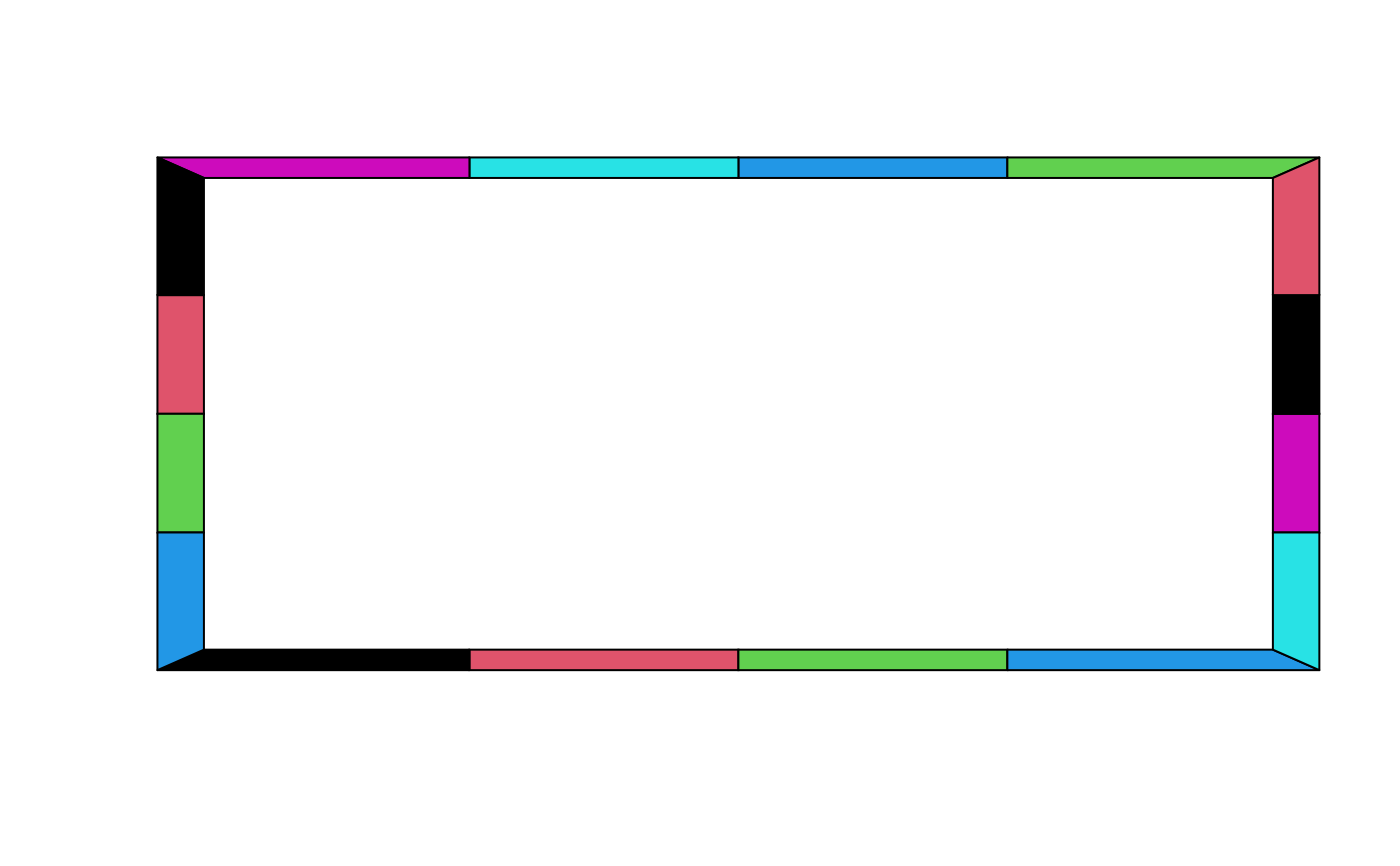
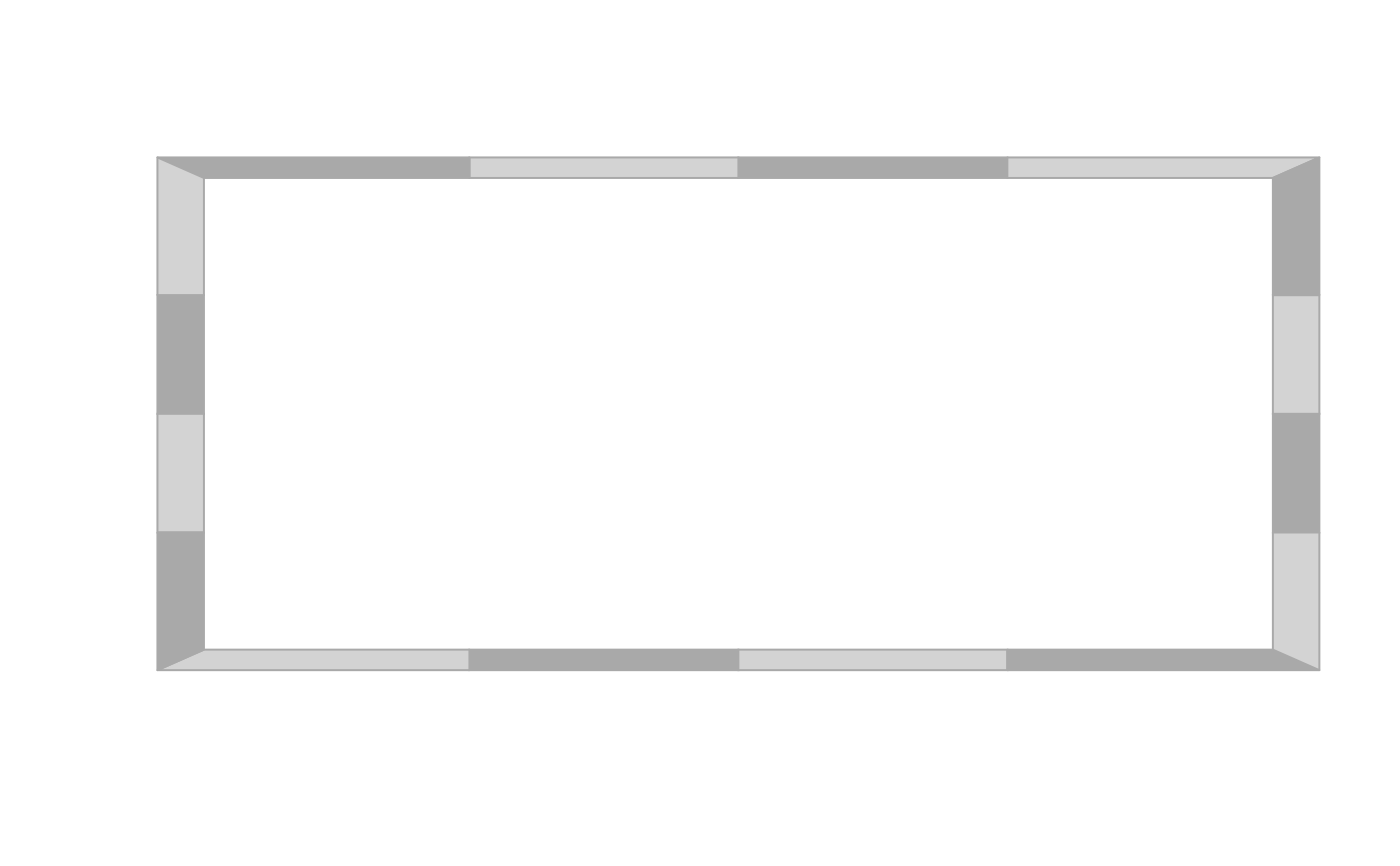
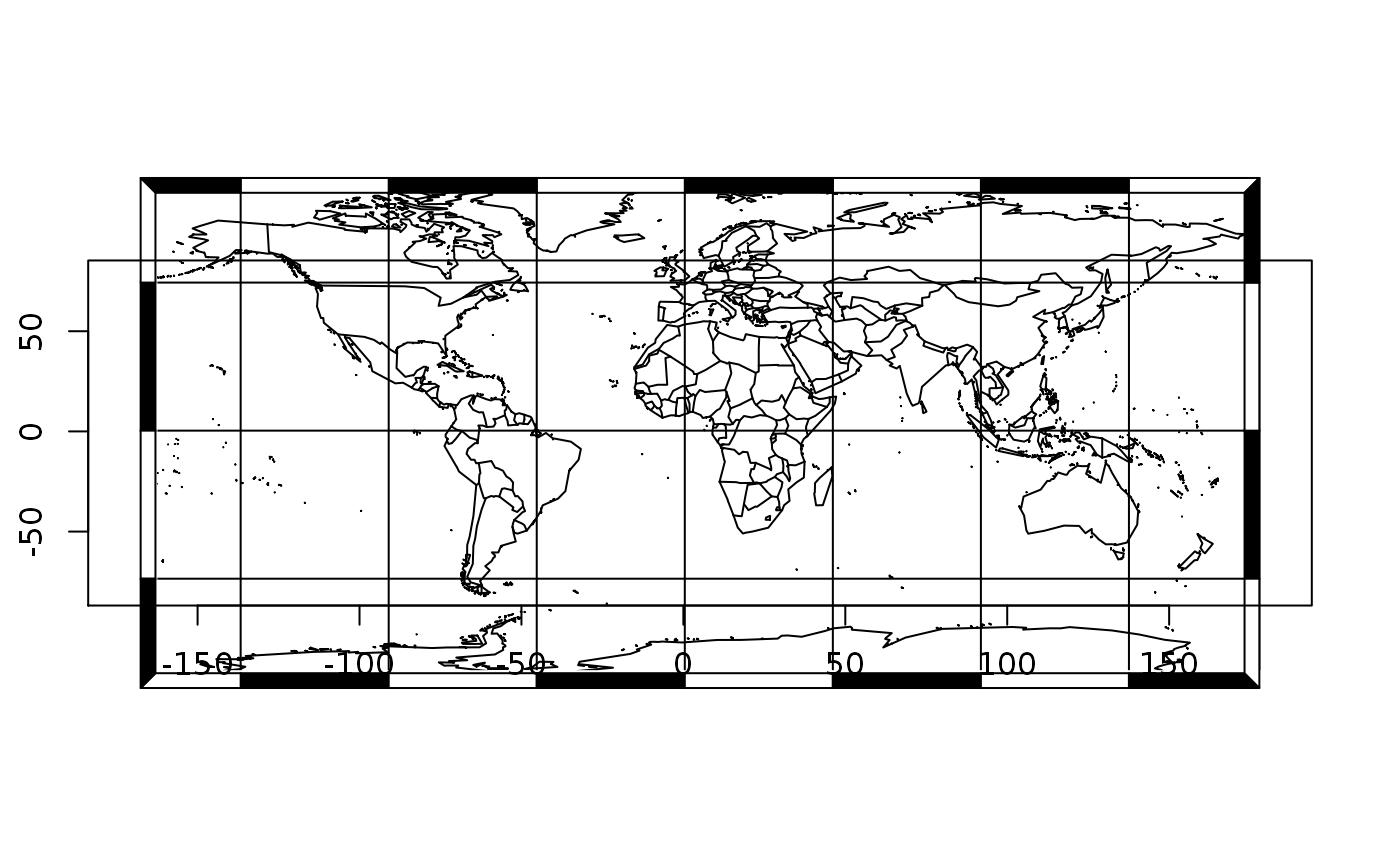
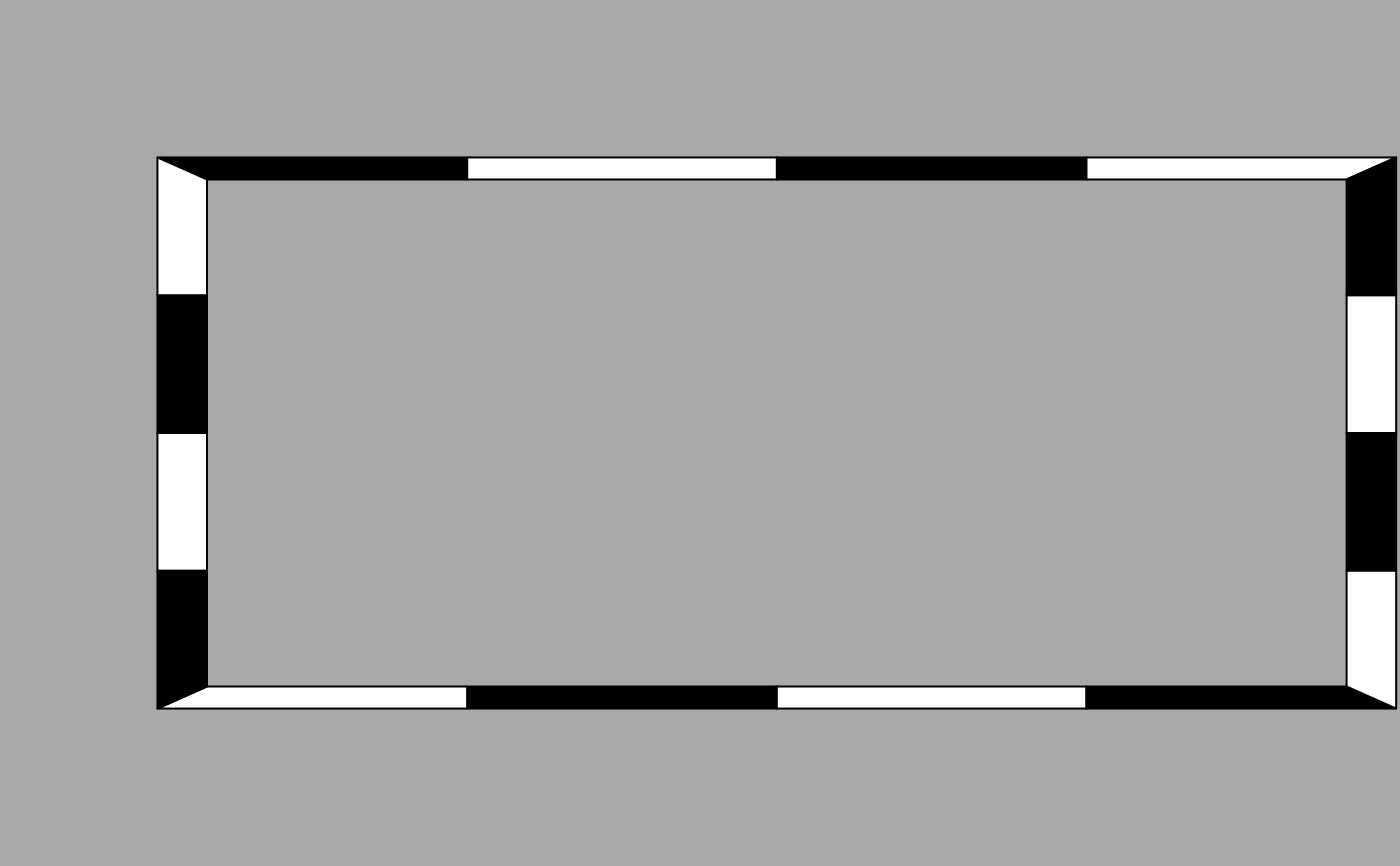
This function adds a checkerboard-like frame around an existing plot (or a new one) as an ensemble of small rectangles whose colors, position and width can be specified by user.
addFrame(
  at_x,
  at_y,
  col = c("white", border),
  border = "black",
  width = NULL,
  lwd = 1,
  lty = 1,
  asp = NA,
  grid = FALSE,
  add = FALSE,
  ...
)
Arguments
| at_x | positions on the x-Axis of the borders of rectangles. |
|---|---|
| at_y | positions on the y-Axis of the borders of rectangles. |
| col | one or several colors of rectangles background. |
| border | color of rectangles border. |
| width | width of the frame. |
| lwd | thickness of rectangles border (and grid). |
| lty | type of rectangles border lines (and grid). |
| asp | aspect ratio of the plot (see |
| grid | a boolean. If |
| add | a boolean. If |
| ... | other graphical parameters as in |
Details
If add = FALSE, a new plot is drawn with xlim = ylim = c(-1, 1). Argument
col can be set with one or multiple colors. If only one color is specified
in col, border color will be used to draw the checkerboard. If width is
NULL, the width of the frame is equivalent to 4% of the extent of the plot
area.
Author
Nicolas CASAJUS, nicolas.casajus@gmail.com
Examples
## Grid and graduations addFrame()addFrame(grid = TRUE)addFrame(grid = TRUE, lwd = 0.25, lty = 3)## Frame width addFrame(width = 0.25)## Colors addFrame(col = 1:6)addFrame(col = "lightgray", border = "darkgray")addFrame(grid = TRUE, add = TRUE, width = 5)## Other graphical parameters addFrame(bg = "darkgray", xaxs = "i", yaxs = "i")